At a glance
- What changed
- Anniversary figures.
- Who it affects
- Readers interpreting growth claims.
- When
- 25 August 2026
RedotPay welcome offer and conditions ↓
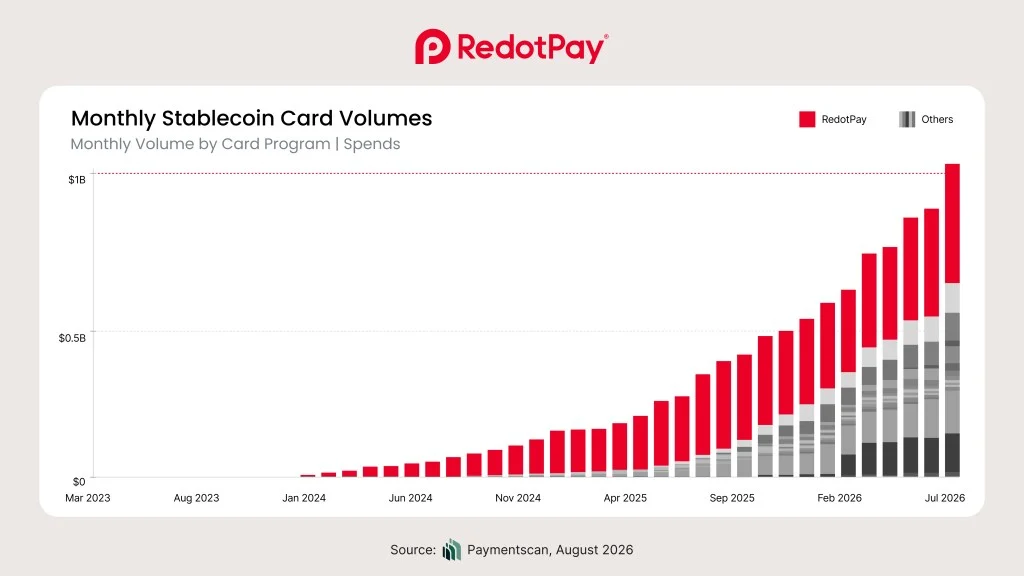
RedotPay marked three years with industry and company figures
RedotPay's 25 August 2026 anniversary article reported more than eight million users and cited Paymentscan data showing over $10.9 billion of cumulative stablecoin-card spending across the industry. Those numbers have different scopes: one describes RedotPay's stated user base, while the other describes a wider category.
The company also discussed future industry growth. Forecasts are opinions about what may happen, not completed payment volume. This article keeps the historical figures separate from those expectations and does not attribute the full industry total to RedotPay.
[1]A cumulative total is different from an annual rate
A cumulative figure adds activity across a stated period. An annualized rate takes a shorter period's activity and expresses what it would represent over a year if that pace continued. A forecast estimates future activity under assumptions. All three can be useful, but comparing them as though they measure the same thing produces misleading conclusions.
The distinction matters in a growing payment category. A large accumulated total may reflect several years of activity, while a recent monthly figure may show a faster current pace. Neither alone tells a reader how evenly the activity is distributed across customers, merchants or countries.
An illustrative volume comparison
Imagine a fictional card category processes 10 million units in January and 20 million in February. The cumulative total for those two months is 30 million. Annualizing February's pace gives 240 million, but that does not mean 240 million has already been processed.
If March then falls back to 10 million, the three-month cumulative total becomes 40 million. The February annualized rate remains a description of a particular pace, not a prediction that the rest of the year was obliged to follow. These invented figures show why dates and measurement periods belong next to a headline number.
Now imagine one provider accounts for 12 million of the 40 million total. Its share in that simplified example is 30%. Reporting the category's 40 million as the provider's own activity would overstate the company figure by more than three times. Attribution is therefore part of the number, not merely a citation added afterward.
A user count does not describe how people use the product
Suppose a hypothetical app has 100,000 registered users. Some may use it weekly, some may have made one purchase, and some may not have completed a transaction. Without a definition and activity period, the total does not reveal the number of active cardholders or the typical user's spending.
The same total could also coexist with very different payment patterns. Ten users making unusually large payments and thousands making small ordinary purchases can contribute similar aggregate volume. A reader interested in everyday adoption needs information about frequency and distribution, rather than assuming the average describes everyone.
This does not invalidate a company's user milestone. It identifies the question that the metric can answer. A total can show the reported reach of an app while leaving open how many people use a particular product and how regularly they return.
What would make the next milestone more informative
A later update would be easier to compare if it used the same definition, period and coverage as the earlier figure. If the measurement changes, explaining that change would be more useful than presenting the larger number as simple growth. A category-wide total also benefits from a clear description of which providers and transaction types are included.
For customers, growth statistics are background rather than a substitute for service terms. A large volume does not establish the fee on the next purchase, the availability of an app in a particular country or the handling of a refund. Those are individual product questions that need their own evidence.
The anniversary article is meaningful as a dated statement about RedotPay's scale and its view of the stablecoin-card market. Its strongest contribution to the archive is the separation of company claims, third-party industry data cited by the company, and forward-looking expectations. Keeping those categories visible lets a reader understand the milestone without turning a broad market narrative into a promise about their own account or a claim that one company processed every payment in the category.
Check the denominator
An original hypothetical exercise. Select a case.
| Case | What it means |
|---|---|
| Company users | One population An invented company count concerns that company’s defined audience. |
| Industry payments | Another population An invented sector total spans multiple firms. Dividing it by one firm’s users would mix scopes. |
Illustration only; it does not check an account or predict a result.
Official sources & further reading
Independently written from the primary sources below. Checked on 26 September 2026.
- Three Years and $10 Billion Later: The Rise of Stablecoin-Powered Card Payments ↗Announcement · 25 August 2026
$5 welcome reward
Enter the code at registration. Reward follows card activation, expires after 30 days and cannot pay issuance fees.
Permanent code and partner link. Campaign dates and benefits are separate.
We may earn a commission, at no extra cost to you. Account and country conditions apply.