At a glance
- What changed
- Configurable grids gain backtesting and live amendments.
- Who it affects
- Eligible Kraken Desktop traders.
- When
- Announced 9 September 2026.
Kraken discount code and conditions ↓
The new Desktop feature
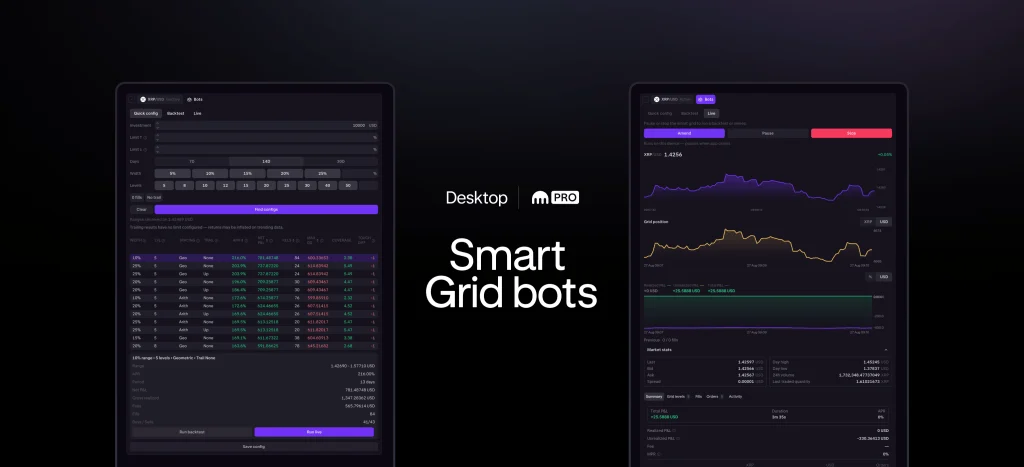
Kraken introduced Smart Grid on 9 September 2026 for eligible Kraken Pro users on Desktop. Users choose an asset, investment amount, price boundaries, number of levels and spacing. They can test that configuration against historical data, save it and amend it while it is running. The launch also includes a strategy stop loss and a margin switch, subject to account and regional limits. Kraken presents the tool as automation that still needs monitoring, rather than a passive-income product.
[1]What a grid means in ordinary language
A grid is a set of planned trading levels across a price range. Instead of making one decision at one price, the trader defines several places where buying or selling should occur. Kraken’s educational guide describes grid bots as rule-based tools for markets moving back and forth. It explains backtesting as applying a proposed configuration to past prices. That exercise shows how the rules would have behaved in the chosen history; it cannot establish what the next market period will do.
The educational guide discusses futures grids, while this news concerns the specific Smart Grid Desktop release. Its general explanation helps describe the idea, but it does not expand the launch’s eligible markets or establish any additional feature.
[2]A simple grid with invented prices
Imagine a fictional asset trading around $100. Alex draws a range from $90 to $110 and marks levels at $90, $95, $100, $105 and $110. The distance between neighboring levels is $5. There are five marked prices but four intervals, a small distinction that matters when describing a configuration. This is a classroom illustration, not a recommended setup or an exact simulation of Kraken’s order placement.
If Alex hypothetically buys one unit at $95 and later sells that unit at $100, the gross difference is $5. If the combined transaction costs in this invented example are $1, the difference after those costs is $4. A completed pair of trades can therefore be profitable while a wider portfolio still loses value. The result of one cycle does not describe unsold holdings elsewhere in the grid.
What happens when the example stops moving sideways
Change the imagined price path. Instead of returning to $100 after the purchase at $95, the asset falls to $80. Alex still owns the unit purchased for $95, now worth $80 in this example. The unrealized difference is minus $15, before any costs. The earlier possibility of earning $5 on a rebound has not disappeared mathematically, but the rebound has not happened. Counting hypothetical future sales as completed profits would misdescribe the position.
This is why a grid must be understood as a set of conditional actions. It does not create the movement needed to complete them. A chart full of orderly levels can look more predictable than the underlying market. The example remains uncertain even if every planned instruction is entered perfectly.
How to use testing and amendments together
For an original test exercise, Alex can examine two different invented histories: one that repeatedly crosses the middle of the range and one that moves steadily downward. Applying the same rules to both reveals which part of the result comes from the rules and which part comes from the price path. Testing only the favorable history would answer a much narrower question.
Changing the range later should also be treated as a new decision. Suppose Alex moves the lower boundary down after the fall. That may make the new settings fit the latest chart, but it does not erase the purchase at $95 or its current value. A useful comparison keeps the existing holdings visible while evaluating the proposed changes. Smart Grid’s editing feature is meaningful because it gives the user a way to respond; it does not decide whether the response is sensible.
In Alex’s example, a narrower $98 to $102 range would answer a different question from the original $90 to $110 range. A favorable result for one configuration cannot simply be assigned to the other. The boundaries are part of the experiment, not cosmetic chart settings.
Explore an invented three-price grid
Choose a step in this invented example.
- $90
Lower reference
A hypothetical purchase of one unit at $90 uses $90.
- $100
Middle reference
Selling that unit at $100 produces a $10 gross difference.
- $70
A falling market
If the unit remains held at $70, its value is $20 below the assumed purchase price.
Illustrative example only. No live quote, account action or guaranteed outcome.
- Announced 9 September.
- Native Desktop feature.
- Historical testing and live amendments.
Official sources & further reading
Independently written from the primary sources below. Checked on 26 September 2026.
- Introducing Smart Grid: fully configurable grid trading, only on Kraken Desktop ↗Announcement · 9 September 2026
- Futures grid trading bots: a beginner’s guide ↗Documentation · 3 December 2025
20% off trading fees
Enter j73wpf7w in the Invite Code field during signup.
Permanent code and partner link. Campaign dates and benefits are separate.
We may earn a commission, at no extra cost to you. Account and country conditions apply.