At a glance
- What changed
- Hyperliquid joins selected aggregated metrics.
- Who it affects
- Readers comparing derivatives activity across exchanges.
- When
- Announced September 23, 2026.
TradingView welcome offer and conditions ↓
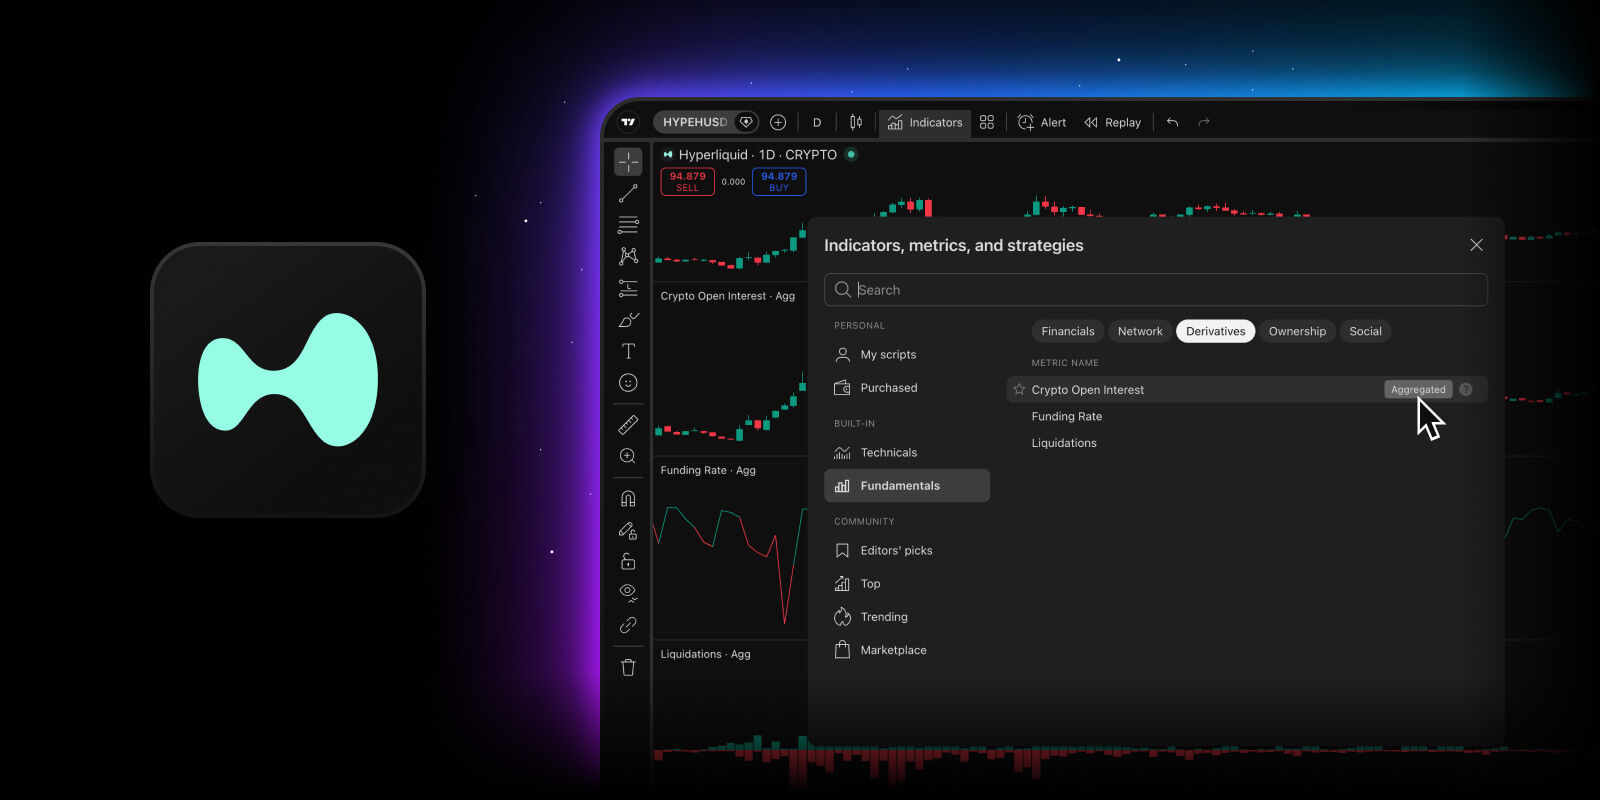
One view of activity across several venues
TradingView now includes Hyperliquid in combined open interest, funding and liquidation data for over 170 assets. Its open-interest and funding history begins September 2025; liquidations begin May 2025. These are coverage dates. Dollar open interest and liquidations are summed; funding is weighted by open interest, with different contributors by metric.
The practical question is how to interpret a number assembled from several markets. Both the selected contributors and the method of combining them matter when explaining why the result changed.
[1]What open interest contributes to the picture
TradingView’s open-interest guide defines the measure as derivatives contracts that remain open. Its chart controls distinguish combined data from a single exchange’s data. The guide also notes that non-aggregated values can be expressed in the base currency, quote currency or contracts, depending on the instrument. A unit label is therefore part of the observation.
This provides useful context for the update: a larger combined value can reflect a broader set of contributors as well as changes in their activity. When researching a change, first establish which series you are viewing and whether you are comparing the same units and coverage. That is our interpretation of the measurement problem, not a claim that a larger reading predicts a particular price move.
[2]How adding a contributor changes a total
Imagine an invented dataset with two venues reporting dollar values of 60 million and 40 million. Their total is 100 million. Add a third venue reporting 20 million, and the combined total becomes 120 million. The first two venues did not grow in this example; the measured group became broader.
Calling that difference a twenty-percent surge in new activity would skip an important explanation. The twenty million was introduced by a change in coverage. To describe the observation accurately, distinguish the expanded total from a change measured across the same original contributors.
This distinction is particularly useful when discussing charts with a historical record. Before attributing a visible change to trader behavior, ask whether the comparison uses the same construction. A clean-looking line does not tell you all of its measurement assumptions. Recording those assumptions makes a chart-based explanation easier to check and less likely to confuse a data update with a market event.
Why a weighted funding average is different
For a separate arithmetic exercise, suppose Venue A has 80 units of open interest and a funding rate of 0.01 percent. Venue B has 20 units and a rate of 0.05 percent. Assume both rates describe the same interval and that the weights are comparable. The total weight is 100.
A contributes eighty percent of the weight and B twenty percent. Multiplying and adding gives 0.8 times 0.01 percent plus 0.2 times 0.05 percent, which equals 0.018 percent. A simple unweighted average would instead be 0.03 percent. The difference comes from the unequal weights, not from a mistake in addition.
These are invented values, not live rates or a prediction of a funding payment. They show why the rate from a smaller contributor can look dramatic without dominating the combined figure. They also explain why the aggregate alone cannot tell you the exact rate faced by a particular position on a particular venue.
How to make a useful comparison
We suggest recording the asset, observation time, metric, units and whether aggregation is enabled. If a combined value looks unusual, inspect its contributors before writing an explanation. This gives you a way to distinguish an arithmetic effect, a coverage difference and a change at an individual venue.
The scenario tool below demonstrates adding values and weighting rates. It is not a live market feed and does not calculate a personal return. Used carefully, the new data can broaden a research view while still leaving room to examine the individual markets underneath it. The most readable conclusion states both the number observed and the scope that gives that number meaning.
What could move a combined metric?
Choose a hypothetical change. All numbers are invented.
| Case | What it means |
|---|---|
| An extra venue | More coverage, unchanged balances Suppose two recorded venues total $100 million. Adding a third with $20 million produces a $120 million total, even if all three balances stay unchanged. The difference comes from coverage; the example establishes no new trading activity. |
| Different weights | The mix changes the average Assume comparable rates of 0.01% and 0.03% for the same interval. Weights of 25% and 75% give 0.025%; equal weights give 0.02%. Neither input rate changed. This is a weighted-average illustration, not a payment or return calculation. |
Illustrative arithmetic only. No live market data, price signal or prediction. [1]
- Coverage dates and announcement dates describe different things.
Official sources & further reading
Independently written from the primary sources below. Checked on 26 September 2026.
- Hyperliquid in aggregated derivatives ↗Announcement · 23 September 2026
- TradingView’s crypto open-interest guide ↗Official product documentation
30-day trial + $15 first-plan coupon
New-user eligibility applies. No code needed; check renewal pricing and coupon terms.
Permanent partner link. Campaign dates and benefits are separate.
We may earn a commission, at no extra cost to you. Account and country conditions apply.