At a glance
- What changed
- An options-volume display on Supercharts.
- Who it affects
- Users researching assets with listed options.
- When
- Announced September 25, 2026.
TradingView welcome offer and conditions ↓
What the new display shows
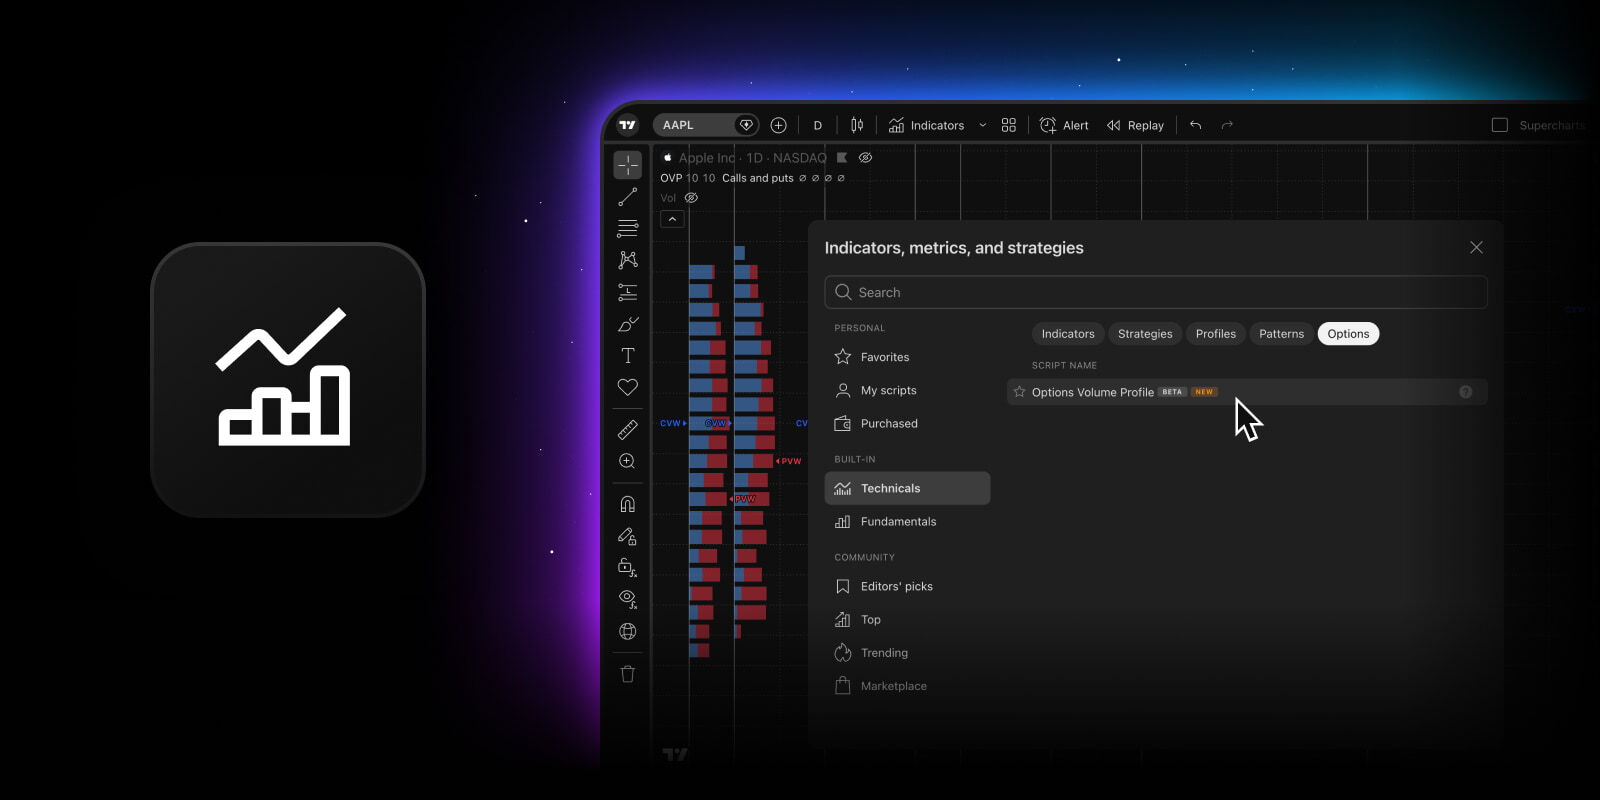
TradingView has launched Options Volume Profile on Supercharts, showing call and put trading volume by strike and expiration. Find it in the Indicators menu’s Options section on an underlying with listed options. Daily, weekly and monthly intervals are supported; intraday profiles are not displayed.
The useful question is what the bars describe. Before interpreting a prominent shape as a signal, identify the inputs and how the selected display mode transforms them.
[1]Understand the measure before interpreting the shape
TradingView defines options volume as contracts traded during the current trading session. A volume figure describes activity during a period. By itself, it does not identify the reason each participant traded. We therefore describe the bars as traded volume, rather than turning them into a complete map of investors’ intentions.
The indicator’s official guide explains that each expiration has a profile and each horizontal bar corresponds to a strike. Its settings can limit the displayed strikes and expirations or group expirations. This makes the chosen view part of the observation: a narrow selection answers a different question from a wider selection that combines more dates.
[2] [3]Four ways to describe one pair of values
The guide lists four modes: separate calls and puts, their combined total, calls minus puts, and puts divided by calls. These are different transformations of the inputs. Switching modes can change the visual emphasis without changing the underlying activity used for the calculation.
For an original example, imagine 120 call contracts and 80 put contracts traded at a particular strike and expiration. Separate bars preserve both numbers. Adding them gives total volume of 200. Subtracting puts from calls gives 40. Dividing puts by calls gives 80 divided by 120, or about 0.67.
Each answer says something different. The total describes how many contracts were traded in the example. The difference describes the numerical gap between the two groups. The ratio expresses one group relative to the other. None of those operations, on its own, tells you which participant was opening a position, closing one or combining the trade with another transaction.
[3]Why scale and ratios need to be read together
Now shrink the invented inputs to twelve calls and eight puts. The ratio is still approximately 0.67, but the combined volume is only twenty instead of two hundred. A matching ratio does not mean matching activity. If a comparison focuses only on the ratio, it can hide that tenfold difference in scale.
For a contrasting example, take twenty calls and eighty puts. Total volume is one hundred, the calls-minus-puts value is minus sixty and the put/call ratio is four. The negative difference and the larger ratio are two ways of expressing the same imbalance in these invented counts; they are not two independent confirmations of a forecast.
Keep the expiration attached to the calculation as well. Combining two different dates may be useful for one question, while examining each separately may be useful for another. State which you did before describing a prominent bar. Otherwise, another reader may assume a concentration belongs to one contract date when your display actually combined several.
There is one simple arithmetic boundary worth remembering: a ratio with calls in the denominator is undefined when the call count is zero. Do not replace that situation with a made-up numerical ratio in your notes. Preserve the two counts so the reader can see what happened without relying on a misleading shortcut.
A practical reading sequence
First identify the underlying, expiration selection and strike range. Then identify the mode and read the exact values behind the bars. Only after that should you write an interpretation. This sequence makes it easier to notice whether a striking shape reflects unusually large inputs or simply the transformation selected for display.
The comparison below uses the invented 120/80 example so you can compare outputs directly. It is not connected to current market data. Select a mode to see how the same inputs produce a total, a difference or a ratio. That exercise helps make the new chart display understandable without suggesting that a particular volume pattern guarantees a price outcome.
One example, four views
Illustrative inputs: calls 120; puts 80. Focus on a row to compare its result.
| Case | What it means |
|---|---|
| Calls and puts | 120 calls | 80 puts Keep the two counts visible. Neither has been added to, or subtracted from, the other. |
| Calls + puts | 200 contracts 120 + 80 = 200. Adding the counts preserves their combined size but removes the split. |
| Calls − puts | 40 contracts 120 − 80 = 40. This is the gap between the counts, rather than their total. |
| Puts / calls | 0.67, rounded 80 ÷ 120 = 2/3. There are two hypothetical puts for every three hypothetical calls. |
Illustrative arithmetic, not live data. [1]
- Total, difference and ratio are different descriptions of the same example inputs.
Official sources & further reading
Independently written from the primary sources below. Checked on 26 September 2026.
- Options volume profile announcement ↗Announcement · 25 September 2026
- TradingView’s definition of options volume ↗Official product documentation
- Options Volume Profile documentation ↗Official product documentation
30-day trial + $15 first-plan coupon
New-user eligibility applies. No code needed; check renewal pricing and coupon terms.
Permanent partner link. Campaign dates and benefits are separate.
We may earn a commission, at no extra cost to you. Account and country conditions apply.