From the archive. This story describes the announcement at its original publication date. Product availability, pricing and terms may have changed.
At a glance
- What changed
- Alerts and maps added.
- Who it affects
- CoinStats web and mobile.
- When
- Late-2025 product roundup.
CoinStats welcome offer and conditions ↓
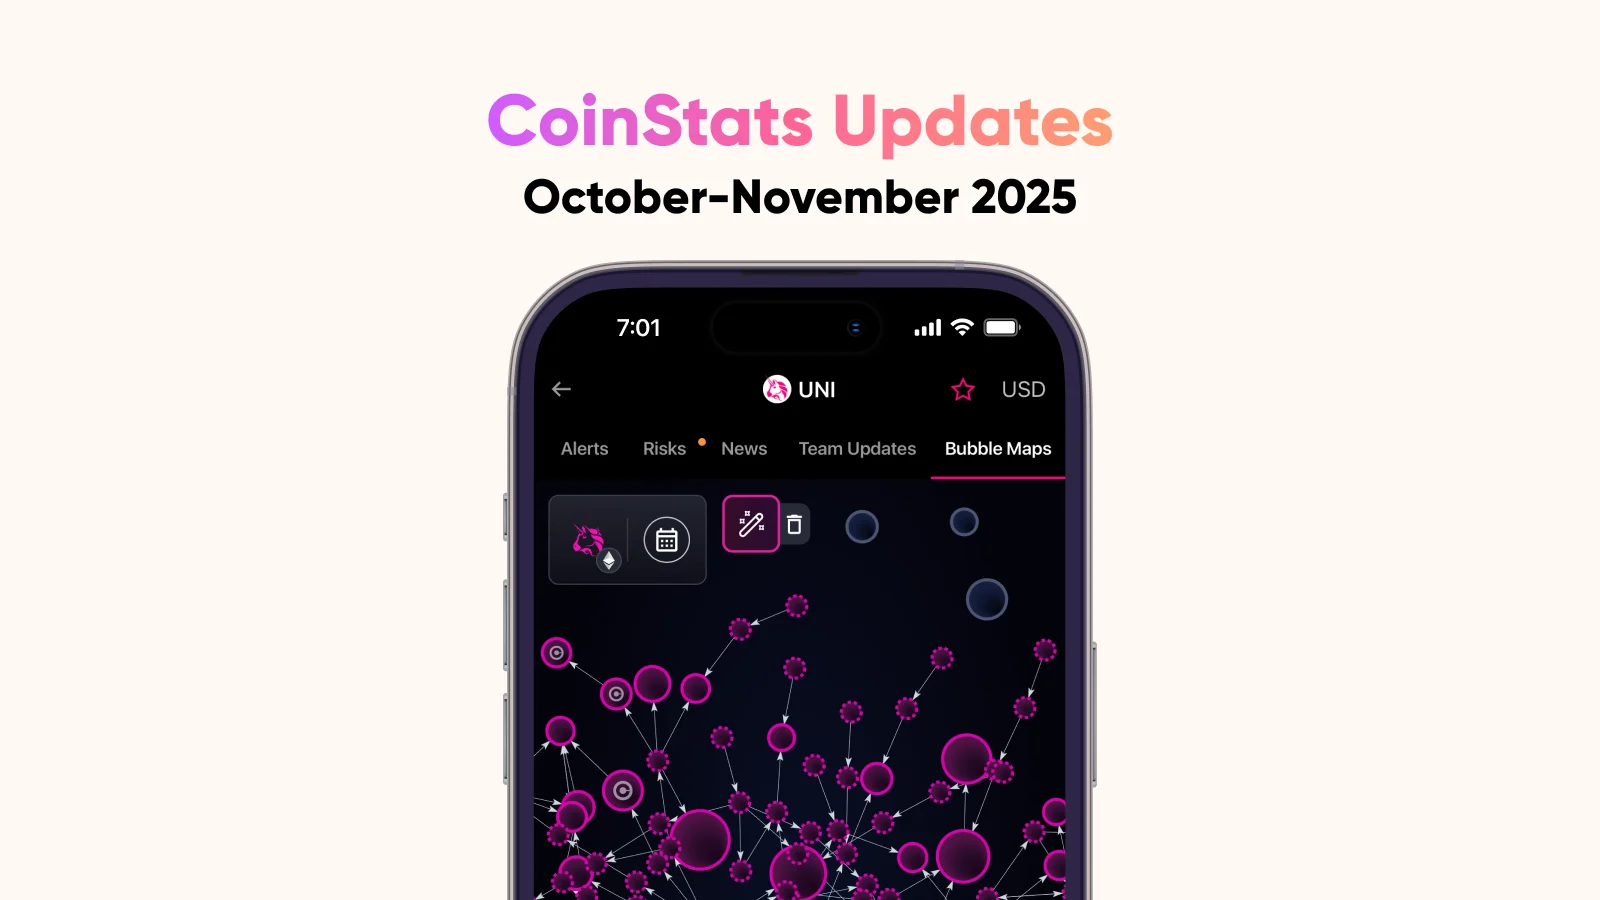
CoinStats combines portfolio alerts and token maps
CoinStats’ late-2025 product roundup added alerts based on total portfolio value and integrated Bubblemaps into mobile and web views. It also described new performance charts and expanded historical transaction access. The changes address different questions: when a portfolio crosses a chosen level, how its value changed and what relationships can be explored in token-distribution data.
[1]A portfolio alert needs an intentional threshold
Imagine a fictional portfolio valued at 10,000 units of currency. A reader wants a reminder to review it after a 5% decline. Five percent of 10,000 is 500, so a corresponding illustrative level would be 9,500 if the starting scope and other assumptions stay the same. This is a calculation for choosing a review point, not a recommendation about where anyone should trade.
The purpose of the alert should be written down before selecting the number. “Review whether anything material changed” is a different instruction from “sell immediately.” An alert can draw attention to an observation; it does not itself supply the reason for a financial action.
The reader should also define which accounts belong to the portfolio being monitored. If another account or a new deposit is added, a total-value threshold may answer a different question than it did originally. Keeping the scope visible makes the notification easier to interpret when it arrives.
Separate money added from investment performance
Suppose the same fictional portfolio rises from 10,000 to 11,000, but the owner added 1,000 during the period. The closing value alone does not establish a 10% gain from the holdings. It includes the new contribution. A useful review therefore places cash movements beside changes in value rather than treating the two as interchangeable.
For another example, imagine two periods with gains of 100 and losses of 40. The separate-period results are 100 and minus 40; the accumulated result after both is 60. A chart of each period and a chart of the running total can look quite different while describing the same sequence.
These are original arithmetic examples. They are not an attempt to reconstruct CoinStats’ complete calculation method or a guarantee about treatment of every transfer. Their purpose is to make the question behind a chart explicit before the reader compares its shape with another chart.
Use a token map to generate a question
A visual relationship between addresses can make a distribution pattern easier to inspect. The next step is to ask what the underlying relationship represents. It should not be automatically turned into a statement that the addresses belong to one person, coordinated a trade or committed misconduct.
Consider a hypothetical map with several large connected circles. A careful research note might say, “These addresses appear connected in this view; inspect the underlying transactions and any reliable labels.” That statement preserves the observation and the work still needed. “One insider owns everything” would be a much stronger claim requiring evidence beyond an attractive visual pattern.
The distinction is important because a map can feel more conclusive than a table even when both are based on the same limited information. Our suggested use is to identify where further research would be valuable, then document which facts support any conclusion. This example does not assert a particular Bubblemaps algorithm or describe a real token’s ownership.
Build a review from the right pieces
A practical workflow could begin with a portfolio-value alert, continue with the relevant transaction history and end with a focused investigation of an asset that contributed to the change. Each stage should answer a specific question. The alert identifies a moment worth reviewing; the history explains activity; additional visual analysis may reveal something worth checking.
If the stages do not support a confident explanation, keep that uncertainty in the result. A notification and a cluster appearing on the same day do not prove a causal connection. The reader should be able to show the transactions or official information linking the two before presenting that conclusion to someone else.
Our reading is that the update is useful because it places several kinds of evidence closer together. Its value is greatest when the reader knows which question each view can answer. A combined interface can reduce searching, but it should not collapse a portfolio threshold, a performance calculation and a token-distribution hypothesis into one supposedly definitive signal.
Which question are you investigating?
Choose a workflow to see what the change means.
- Why did my balance change?
Inspect flows and performance
Compare portfolio charts with inflow and outflow views.
- How is a token distributed?
Open the distribution map
Use wallet clusters as a starting point for investigation.
Feature scope follows the dated announcement. [1]
- Portfolio-value alerts.
- Bubblemaps integration.
- Additional performance charts.
Official sources & further reading
Independently written from the primary sources below. Checked on 26 September 2026.
- Bubblemaps Integration, Portfolio Alerts, AI-Powered Intelligence, ... ↗Announcement · 25 December 2025
Free Premium trial
No code needed. Check trial length, renewal price and eligibility before starting.
Permanent partner link. Campaign dates and benefits are separate.
We may earn a commission, at no extra cost to you. Account and country conditions apply.