At a glance
- What changed
- An assistant inside the chart.
- Who it affects
- Paid-plan users on web and desktop.
- When
- Announced 28 September 2026.
TradingView welcome offer and conditions ↓
What has changed
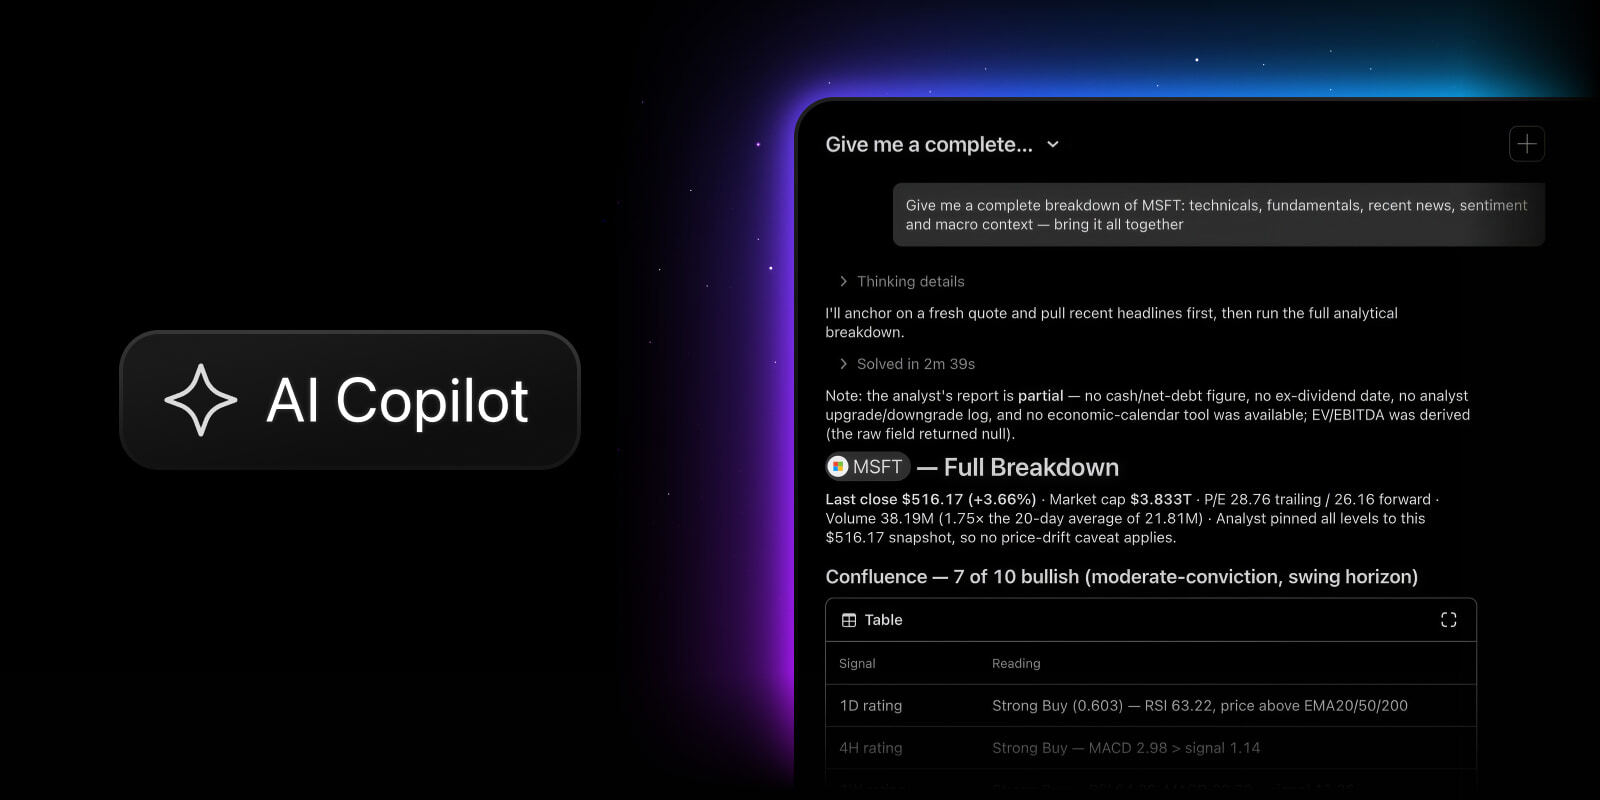
TradingView announced on 28 September 2026 that AI Copilot is available inside its charts as a separately purchased assistant. Essential, Plus, Premium and Ultimate subscribers can use it on the web or desktop; mobile apps are not supported yet. It can work with chart data, change the chart, create alerts and write Pine Script, TradingView’s programming language.
[1]Getting access and understanding the bill
An active paid-plan trial also qualifies. Open a chart, sign in, select the right-hand AI icon and choose Get access. Payment activates access. The add-on renews monthly, can be cancelled in profile settings and has a monthly usage allowance without rollover. The announcement supplies neither a price nor an allowance number. Review checkout for those figures. TradingView warns that answers can be wrong.
[1]Start with a chart you can compare
A layout is a saved chart workspace: it keeps the symbol, time interval, indicators and other settings together. TradingView’s layout guide explains how to save a layout or make a copy. That gives a practical way to compare an existing workspace with a revised version instead of relying on memory after several changes.
For a first experiment, our suggested workflow is to keep one original layout and use another for the requested change. Give the comparison a specific purpose: perhaps you want a less crowded chart, or want to examine one asset over a different interval. Afterwards, compare the symbol, interval and visible settings in the two views. A chart that looks cleaner has passed a presentation check; whether it answers your market question remains a separate judgment.
[2]An alert needs a precise condition
TradingView’s alert documentation distinguishes price alerts from technical alerts based on indicators, drawings or strategies. The selected interval matters for technical calculations. It also explains that an alert created with particular indicator settings keeps those settings even if the indicator is subsequently changed. This is useful background when an assistant helps with chart setup: the visible chart and an already saved notification may describe different conditions.
Consider an invented request to be notified when an asset moves above $80. Before using it, clarify whether the intended event is a price reaching that level or an indicator meeting a particular condition. Then inspect the saved alert and its notification destination. If you later change the analysis, revisit the alert rather than assuming it followed the change. The $80 figure is simply an example of making a request testable, not a market level or trade suggestion.
[3]Generated strategies still need a fair test
A backtest simulates a strategy using historical market data. TradingView’s Pine documentation says the results depend on assumptions about execution and costs. Commission, meaning the fee charged for an executed order, is one adjustable assumption; if the script specifies none, the simulation applies none by default. Slippage is the difference between an expected fill price and the price actually obtained.
The same documentation warns about lookahead bias: accidentally allowing a historical strategy to use information that was not available at the time. A successful-looking test can therefore reflect an unrealistic assumption. Inspecting generated code means checking what it actually calculates and when information becomes available, not just whether the program runs.
Here is a simplified cost example using invented amounts. A simulated trade makes $12 before charges. If entry and exit each cost $4, the remaining result is $4 before any other effects. If those two charges are $7 each, it becomes a $2 loss. Neither case estimates a TradingView fee. The arithmetic shows why a report’s assumptions deserve attention before comparing its headline result with another strategy.
[4]Choose a small, observable first task
Our reading of the release is that the most useful first test is a task whose result you can inspect. Begin with one chart change, one clearly defined notification or one understandable calculation. Combining all three immediately makes it harder to identify where an unexpected result came from.
For example, compare the copied layout first, inspect the saved alert next, and only then examine a strategy report. This sequence separates three questions: did the workspace change as intended, does the notification describe the intended event, and does the simulation use plausible assumptions? It also gives you a concrete way to judge usefulness before committing more time to a complicated workflow.
[2] [3] [4]Which result are you checking?
Highlight a task to compare the review steps.
- Chart setup
Compare the workspace
Keep a copy of the original layout and inspect the changed symbol, interval and settings.
- Notification
Inspect the saved condition
Check what triggers the alert and where it sends the notification.
- Strategy test
Read the assumptions
Review execution costs and whether the calculation relies on information available at the time.
Illustrative review steps; no account access or trading takes place here. [2] [3] [4]
- Simulation costs can change the sign of a result.
Official sources & further reading
Independently written from the primary sources below. Checked on 28 September 2026.
- AI Copilot comes to TradingView ↗Official announcement
- TradingView layouts: a quick guide ↗Official supporting documentation
- Introduction to TradingView alerts ↗Official supporting documentation
- Pine Script: Strategies ↗Official supporting documentation
30-day trial + $15 first-plan coupon
New-user eligibility applies. No code needed; check renewal pricing and coupon terms.
Permanent partner link. Campaign dates and benefits are separate.
We may earn a commission, at no extra cost to you. Account and country conditions apply.