At a glance
- What changed
- Derivatives indicators on supported Hyperliquid and HIP-3 charts.
- Who it affects
- TradingView users researching perpetual contracts.
- When
- Announced September 21, 2026.
TradingView welcome offer and conditions ↓
What the announcement adds
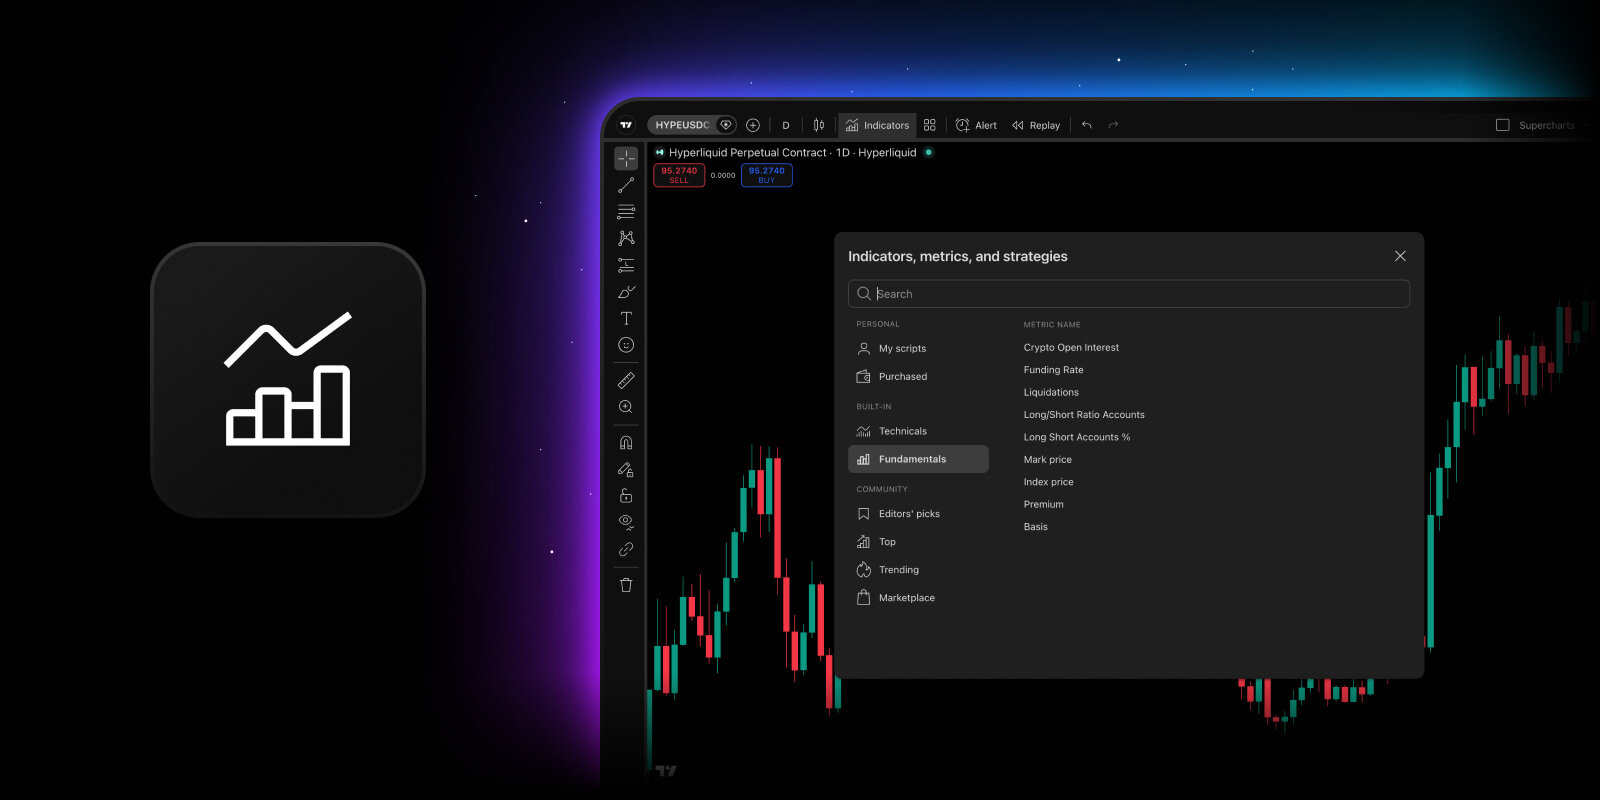
TradingView has added nine derivatives indicators for more than 170 Hyperliquid contracts, plus Trade[XYZ] and Paragon markets for combined coverage above 300. Search HYPERLIQUID:, HIP3XYZ: or HIP3PARA:, then find indicators under Fundamentals. Measures include funding and liquidations.
The extra information becomes useful once its units are understood. Funding deserves particular attention because a payment schedule and the period represented by a displayed percentage are two different things. Comparing the numbers without those labels can produce a misleading result.
[1]Why funding needs an explanation
Hyperliquid’s official documentation describes funding as periodic payments between the long and short sides of a perpetual contract. The mechanism helps keep the contract’s price connected to its underlying reference. Depending on the rate’s sign, one side pays and the other receives. It is not a guaranteed reward for simply holding an asset.
The documentation states that payments occur hourly and calculates a payment using position size, oracle price and the applicable funding rate. The rate formula is expressed on an eight-hour basis, with hourly payments at one eighth of the computed rate. That makes the label on a displayed rate important: an hourly payment schedule and an eight-hour quoted rate are not interchangeable units.
[2]Compare periods before comparing percentages
Consider a deliberately simplified arithmetic example. One hypothetical display gives 0.01 percent for each hour, while another gives 0.01 percent for an eight-hour period. Although the printed percentages match, the periods do not. Holding each assumed rate constant, eight hourly amounts add to 0.08 percent, while the single eight-hour amount remains 0.01 percent.
This exercise is not a quotation of an actual Hyperliquid rate. It also does not project a return: real rates, position values and payment eligibility can change. Its purpose is to show why copying two percentages into a comparison without their time units can produce a misleading result.
A second way to see the problem is to write the units beside the number before doing any multiplication. “Percent per hour” and “percent per eight hours” make the mismatch visible. If the source does not identify the period clearly, stop the comparison at that point rather than silently assuming that two similarly formatted fields mean the same thing.
Separate the instrument from the observation
For a useful research note, identify the exact symbol and venue before recording the indicator value. Then include the observation time, the metric and its units. This is our suggested method for keeping a comparison reproducible. A ticker alone can be an incomplete description when similarly named instruments appear in different markets.
Imagine two records labeled only “funding: 0.01 percent.” One was taken in the morning and the other several hours later, and neither includes the contract. Even if both numbers were copied correctly, the records cannot support a precise claim about which venue was more expensive at the same moment. The missing context is part of the result, not a cosmetic omission.
The same discipline helps when revisiting a chart screenshot. Write the reason you captured it: perhaps you wanted to examine whether a change in one measure accompanied a price movement. That wording preserves an observation to investigate, instead of turning a visual coincidence into a claim about what caused the move.
A useful next step after opening the chart
Begin with one contract and one clearly defined question. Check the indicator description, establish the units and compare observations on a consistent basis. Expanding to more markets is worthwhile once that first record is understandable to someone who did not create it.
The interaction below uses an invented constant-rate comparison to make the interval issue visible. It is not a funding forecast or an income calculator. The release supplies additional evidence for research; the reader still needs to establish what each observation measures before combining it with another. That is the difference between having more numbers on a chart and being able to explain them.
Match the percentage to its period
Choose an illustrative case to follow the explanation.
| Case | What it means |
|---|---|
| 0.01% per hour | 0.08% over eight constant periods Eight times 0.01% equals 0.08%. This assumes an unchanged hypothetical rate. |
| 0.01% per eight hours | 0.01% for one period One eight-hour period at the invented 0.01% rate contributes 0.01%, not 0.08%. |
Original learning exercise; no live market data or account action.
- A rate comparison needs the period as well as the percentage.
Official sources & further reading
Independently written from the primary sources below. Checked on 26 September 2026.
- Introducing derivative metrics for Hyperliquid ↗Announcement · 21 September 2026
- Hyperliquid’s official funding mechanics ↗Official product documentation
30-day trial + $15 first-plan coupon
New-user eligibility applies. No code needed; check renewal pricing and coupon terms.
Permanent partner link. Campaign dates and benefits are separate.
We may earn a commission, at no extra cost to you. Account and country conditions apply.