At a glance
- What changed
- Alerts attached to position drawings.
- Who it affects
- Users mapping possible trades on charts.
- When
- Announced August 28, 2026.
TradingView welcome offer and conditions ↓
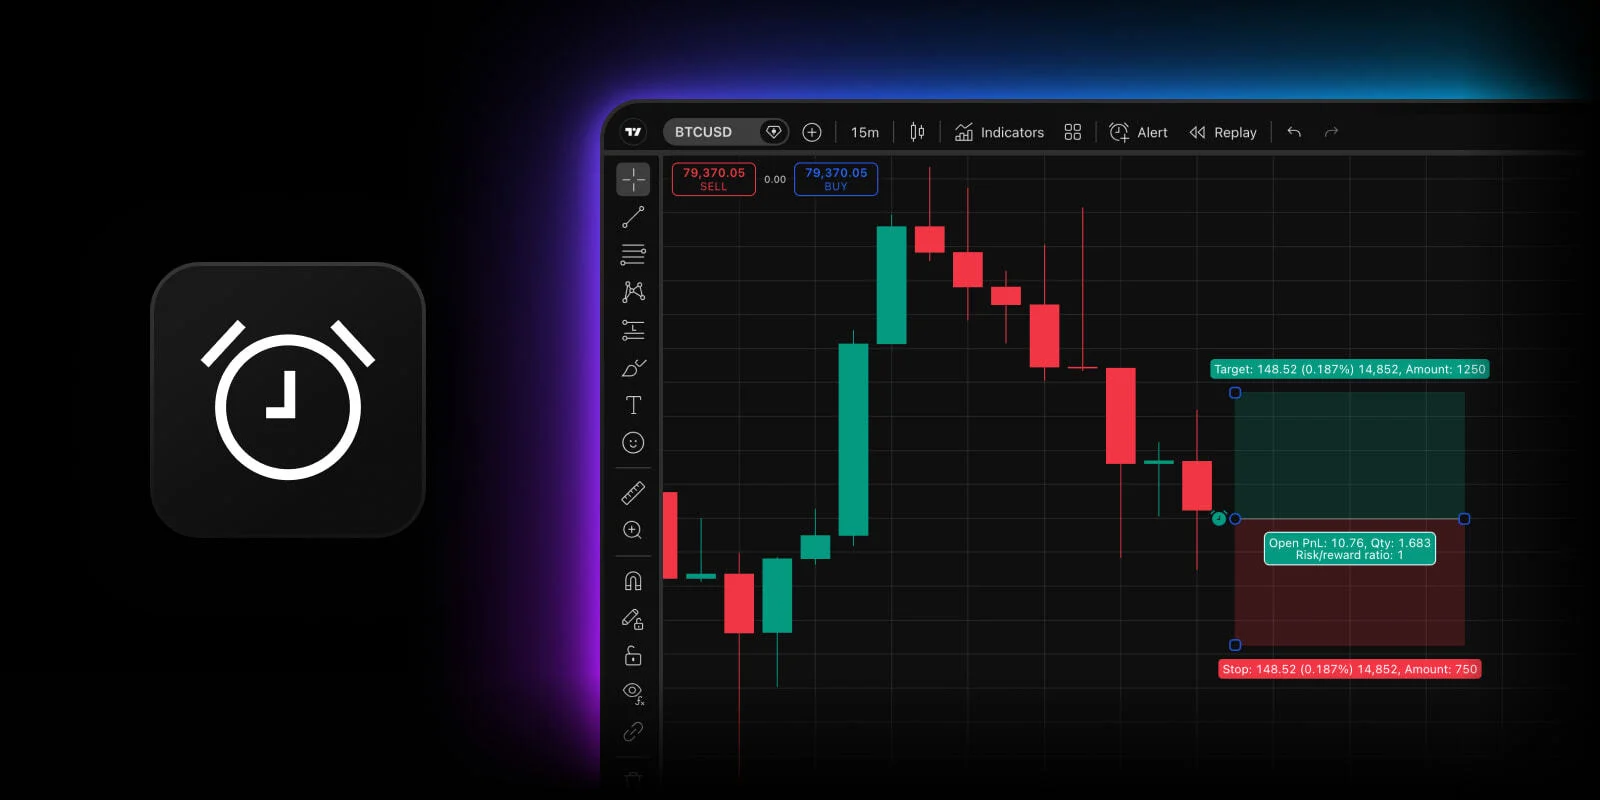
A drawing can now notify you about its levels
TradingView now lets one alert watch a long or short position drawing’s entry, stop and target. It continues after the entry notification and stops after the stop or target is reached. Editing the drawing restarts monitoring. Create the alert from the drawing’s context menu or toolbar.
The change links a visual plan with a notification. Understanding that link starts with a distinction between a proposed trade drawn on a chart and a transaction recorded by an actual brokerage account.
[1]A planning tool is not an executed trade
TradingView’s documentation says the drawing tools estimate a position’s outcome without requiring an actual order. They can show a proposed position size, profit and loss, and risk-to-reward relationship from the settings entered. A notification about the drawing therefore describes a monitored level; it is not proof that a broker opened or closed a position.
The guide calculates the long-position reward-to-risk relationship using the distance from entry to target divided by the distance from entry to stop. Real outcomes require separate execution records. This article uses a simplified example below to explain the planned distances, without treating the drawn stop as a guarantee of an actual exit price.
[2]An example with an entry of 100
Imagine a simple, unleveraged illustration with an entry at 100, a stop at 95 and a target at 110. The planned distance to the stop is five units; the planned distance to the target is ten. Ten divided by five gives a two-to-one relationship between those distances. These are invented prices chosen to make the calculation easy to follow.
For ten units of the asset, the corresponding gross amounts would be 50 at the stop distance and 100 at the target distance. This arithmetic excludes fees and any difference between a drawn level and an actual execution. It describes the proposed geometry of the trade, not the probability of either outcome.
Two plans can have the same two-to-one relationship while involving different amounts. If another drawing uses only two units at the same prices, its gross amounts are ten and twenty. The ratio stays the same because both amounts shrink together. That is why a ratio by itself does not tell you how much money the person has put at risk.
Read the notification in context
For a practical workflow, give the drawing a clear purpose in your notes: for example, “observe whether the proposed entry area is reached.” When a notification arrives, compare the instrument and level with that note. This helps distinguish an observation about a plan from an instruction to take action.
If you also have an actual broker order, check its own status separately. A chart price and an order record answer different questions. The first can show what the chart observed; the second establishes what happened to the submitted order. Keeping both records avoids turning a notification into an assumed fill.
It is particularly useful to record when you revise the plan. In the example above, moving the stop from 95 to 98 changes the planned stop distance from five to two. With the same target at 110, the distance ratio changes from two-to-one to five-to-one. That is a new set of assumptions, not a retrospective improvement in the earlier plan.
Reviewing the result afterward
When looking back, keep the initial drawing, any subsequent changes and any actual trades in chronological order. You can then ask whether the alert helped you notice the event you intended to monitor. That is a more precise evaluation than judging the feature by whether the market later moved favorably.
The scenarios below compare the planned distances after changing the stop in our invented example. They do not send notifications or place orders. Use them to understand what a drawing alert is supposed to follow, then verify the exact settings in your own chart. The useful improvement is a closer connection between a written plan, its visible levels and the moment you are prompted to review it.
Understand the proposed distances
Choose an illustrative case to follow the explanation.
| Case | What it means |
|---|---|
| Stop 95 | Two-to-one Entry 100 and target 110 give distance 10; a stop 95 gives distance 5. Ten divided by five equals two. |
| Stop 98 | Five-to-one With the same entry and target, the stop distance becomes 2. Ten divided by two equals five. |
Original learning exercise; no live market data or account action.
- A drawing alert does not establish that a broker order filled.
Official sources & further reading
Independently written from the primary sources below. Checked on 26 September 2026.
- Alerts come to long and short position drawings ↗Announcement · 28 August 2026
- Long and short position drawing tools ↗Documentation
30-day trial + $15 first-plan coupon
New-user eligibility applies. No code needed; check renewal pricing and coupon terms.
Permanent partner link. Campaign dates and benefits are separate.
We may earn a commission, at no extra cost to you. Account and country conditions apply.