At a glance
- What changed
- Moving averages in Screener chart view.
- Who it affects
- Users comparing supported markets on paid plans.
- When
- Announced September 11, 2026.
TradingView welcome offer and conditions ↓
What is new in the Screener
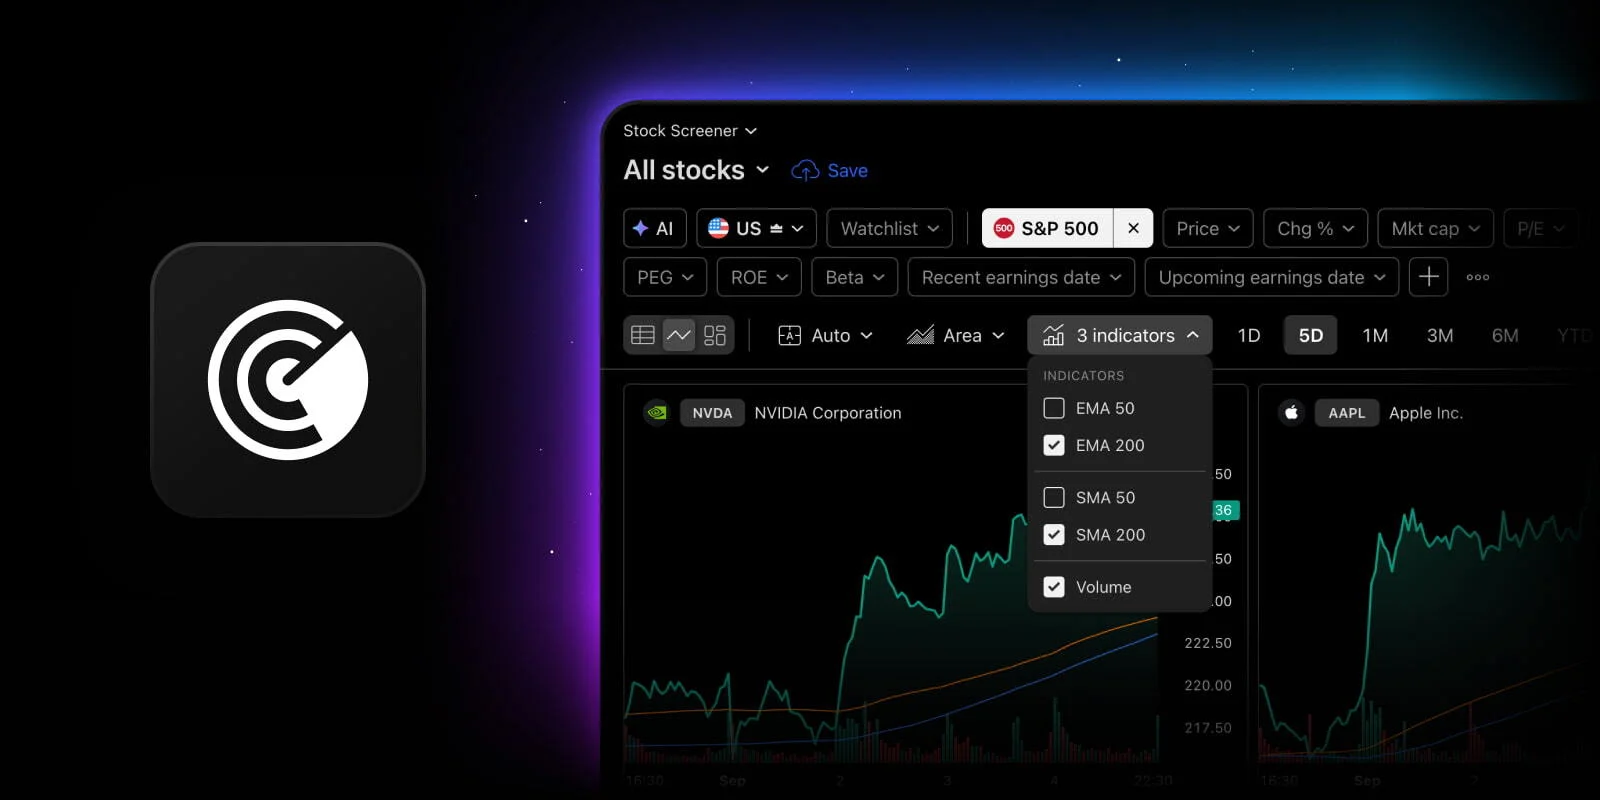
TradingView has added preset 50- and 200-period SMA and EMA lines to Screener mini charts. Moving averages require a paid plan. The update covers Stock, ETF, Crypto Coins, CEX and DEX screeners; volume is excluded from Crypto Coins, and Bond Screener is unchanged. Changing the interval recalculates the lines across the charts.
For a reader, the useful first step is understanding what a line summarizes. A moving average can make a chart easier to compare, but its meaning depends on both the calculation and the period being examined.
[1]What an average adds to a price chart
TradingView’s moving-average guide explains that a simple moving average gives equal weight to the prices in its window. An exponential moving average gives greater weight to recent prices. Both use past observations, so they are descriptions of an evolving price series rather than knowledge of its future.
The length refers to observations on the chosen interval. A longer window smooths more history, while a shorter window responds to changes over a smaller set of observations. The guide describes moving averages as lagging indicators: their values follow the data used in the calculation. A smooth line can clarify a pattern without establishing that the pattern will continue.
[2]A small calculation makes the idea easier to see
Take five invented closing prices: 10, 11, 12, 13 and 14. Their sum is 60, so their simple average is 12. This five-value exercise is only a teaching example; it is not a claim that the new Screener menu offers a five-period setting.
Now add a new close of 20 and remove the oldest value, 10. The five prices become 11, 12, 13, 14 and 20. Their sum is 70 and their average is 14. The latest price jumped from 14 to 20, but the average moved from 12 to 14 because it still includes the other observations.
That difference explains why a line can appear calm next to a sharp candle. It is answering a different question. The newest price describes one observation; the average describes the selected window. Neither number becomes incorrect simply because the two are far apart. The distance is something to investigate, not an automatic instruction to buy or sell.
Keep comparisons on the same basis
Suppose you are comparing two mini charts and one uses daily bars while the other example in your notes uses hourly bars. A label of 50 does not make those examples cover the same span of history. Before comparing their shapes, write down the interval as well as the length. Otherwise, an apparent difference between two assets might actually reflect the different questions you asked of the data.
An orderly review could start with a small group of symbols on a common interval. Observe where each latest price sits relative to the same average. Then open the individual charts that need closer inspection. That is our suggested research sequence, not a rule that a particular position relative to a line produces a profitable trade.
It also helps to compare like with like when describing results. Saying “above its 200-period average on daily bars” preserves the setting that produced the observation. Saying only “strong” removes that context and introduces a judgment that the line alone cannot justify.
Using the new view without overloading it
For a first pass, choose one question and only the lines needed to answer it. If you want to compare a faster and slower reference, identify both clearly in your notes. Adding more colors without a purpose can make the mini charts harder to scan, especially when many symbols are visible at once.
The interaction below calculates the average before and after one invented price changes. It is a reading aid, not a live scanner. The update makes comparative research more convenient, but the useful result is a better-defined question for further investigation. Keep your observations, their settings and any later decision as separate steps, so you can revisit how you reached that decision.
Try the five-price example
Choose an illustrative case to follow the explanation.
- 10,11,12,13,14
Average 12
The five invented values sum to 60; divide by 5 to obtain 12.
- 11,12,13,14,20
Average 14
Replacing 10 with 20 increases the total to 70; divide by 5 to obtain 14.
Original learning exercise; no live market data or account action.
- The preset moving-average lengths are 50 and 200 periods.
Official sources & further reading
Independently written from the primary sources below. Checked on 26 September 2026.
- Screener chart view adds moving averages and more flexibility ↗Announcement · 11 September 2026
- TradingView’s moving-average calculation guide ↗Official product documentation
30-day trial + $15 first-plan coupon
New-user eligibility applies. No code needed; check renewal pricing and coupon terms.
Permanent partner link. Campaign dates and benefits are separate.
We may earn a commission, at no extra cost to you. Account and country conditions apply.