At a glance
- What changed
- Bond analytics.
- Who it affects
- Registered users.
- When
- Announced 8 October.
TradingView welcome offer and conditions ↓
More than a quoted yield
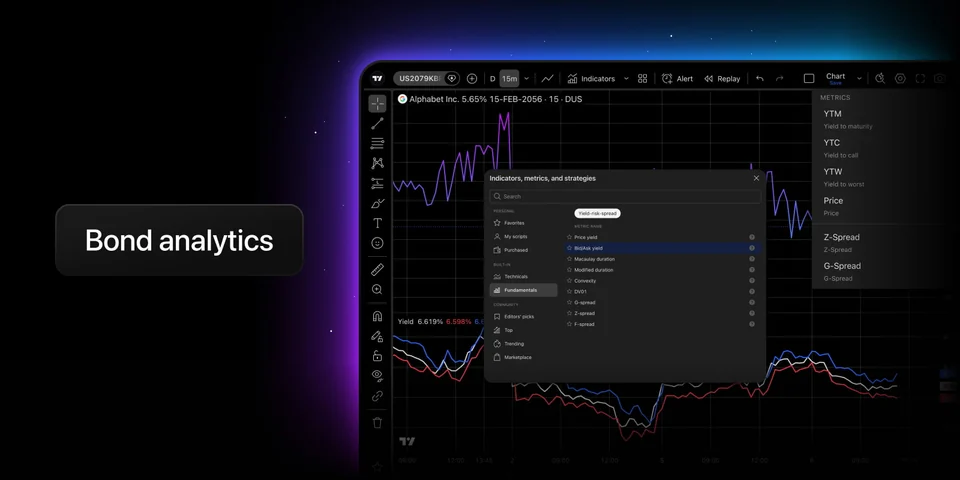
TradingView introduced bond risk and spread analytics on 8 October for registered users. Charts, indicators and two new Bond Screener views connect rate sensitivity with benchmark comparisons. Find the indicators under Fundamentals → Yield-risk-spread. The announcement gives no feature price or geographic coverage list.
First check which repayment outcome the yield describes
A bond represents borrowing that will be repaid under its terms. Yield expresses the annualized return implied by its price and payments. Before comparing the new analytics, identify the repayment assumption. TradingView’s supporting guide defines yield to worst as the lowest calculated yield among maturity and the relevant early repayment outcomes. This is a comparison of specified payment scenarios, not a guarantee against every possible loss.
An issuer’s call allows early redemption; a holder’s put provides an early exit right. TradingView includes the nearest put date and excludes later events from this calculation. A maturity date alone therefore does not necessarily identify the repayment date behind the displayed yield. That distinction carries through to the benchmark comparison below.
Read rate sensitivity in the right units
For the risk view, distinguish a percentage sensitivity from a cash amount. Modified duration describes price sensitivity to a change in yield. DV01, the dollar value of one basis point, translates that sensitivity into money for one bond. A basis point is one hundredth of a percentage point. TradingView calculates DV01 by multiplying modified duration by the bond price, including accrued interest, and by 0.0001.
For an explicitly hypothetical dollar bond priced at $1,000 including accrued interest, a modified duration of four gives a DV01 of $0.40. That is the approximate price sensitivity to a one-basis-point yield movement. It is not a $0.40 coupon payment. TradingView’s definition uses the issue currency and one bond’s denomination: comparing raw DV01 figures across differently sized bonds can confuse a larger unit with greater percentage sensitivity.
Keep large rate moves separate from a straight-line estimate
The convexity field adds a second consideration when interpreting that sensitivity. Duration treats the local relationship between price and yield as a straight line. Convexity describes its curvature, so the estimated effect of a larger yield change need not scale perfectly from a tiny change. TradingView’s documented approximation combines the duration term with a correction based on convexity and the square of the yield change.
The result remains an estimate based on the chosen inputs. A reader comparing risk columns should distinguish that model from an observed transaction price. The useful question is how the estimate changes when the assumed yield movement becomes larger, rather than treating a sensitivity measure as a promised future valuation.
Compare the bond with a matching government benchmark
The spread view asks a different question: how does the bond’s yield compare with a reference? TradingView defines G-spread as the bond’s yield minus a government benchmark yield, expressed in basis points. Its calculation uses yield to worst and matches the benchmark term to the redemption date producing that yield. Where necessary, it estimates the matching benchmark between surrounding published maturities.
A hypothetical bond yield of 5% against a matching 4% benchmark produces a 100-basis-point G-spread. The result describes the gap between those yields; it is not an extra payment on top of the bond’s quoted return. This comparison uses a single benchmark point, so it does not capture the shape of the entire curve.
Use the payment schedule when one benchmark point is insufficient
Z-spread addresses that limitation by considering the sequence of payments. TradingView’s definition finds one constant premium to add across a government zero-coupon curve, which supplies a discount rate for each payment horizon. Discounting translates future coupon and repayment amounts into present values. The premium is adjusted until their total equals the bond’s market price, including accrued interest.
The calculation includes payments through the redemption date associated with yield to worst. Their timing matters, which is why a simple subtraction of two headline yields cannot reproduce this measure. When comparing issues with different coupons or payment schedules, keep G-spread and Z-spread labelled separately. They answer related questions using different benchmark information; treating them as interchangeable would discard the distinction the new analytics make available.

30-day trial + $15 first-plan coupon
New-user eligibility applies. No code needed; check renewal pricing and coupon terms.
Conditions
The partner link has no expiry. Campaign dates, benefits and eligibility are separate and may change. Check the provider’s current terms before signing up.
We may earn a commission, at no extra cost to you.