At a glance
- What changed
- TradingView adds breadth data to stock-market and index pages.
- Who it affects
- Equity-market readers.
- When
- Announced October 1, 2026.
TradingView welcome offer and conditions ↓
Where the new measures appear
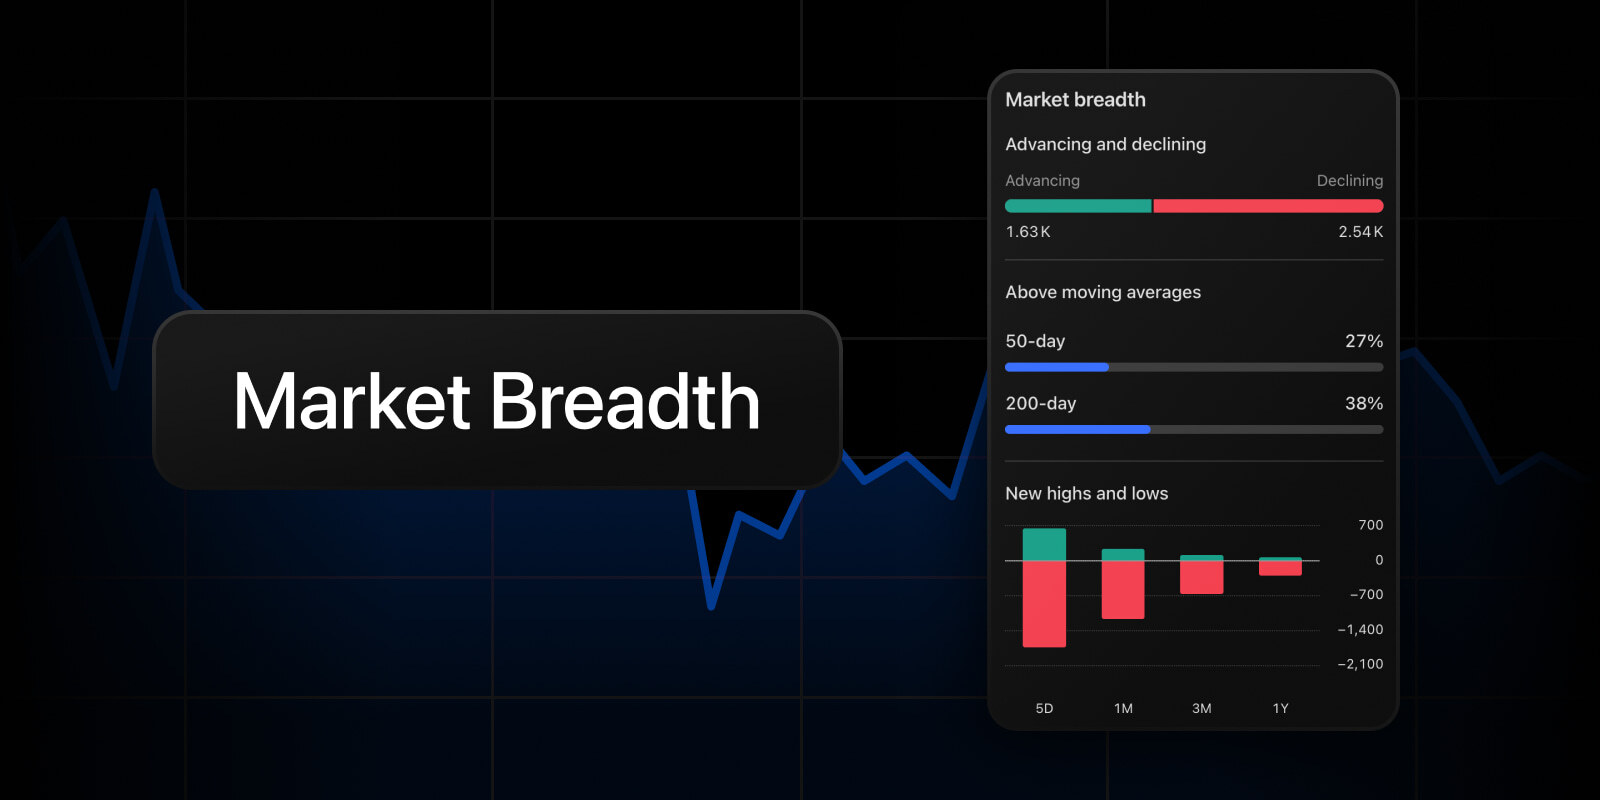
TradingView announced market breadth for its stock-market and index pages on October 1. Breadth describes how widely individual stocks participate in a move, helping equity-market readers look beyond an index's headline change. The announcement places the data in Indices and World Stocks tables, country views and individual index pages. It gives no subscription-tier requirement, separate feature price or application process.
An index page measures its components, while a country page covers the local stock market. Those are different groups, so their readings need not match.
[1]An unchanged stock counts as declining
TradingView compares each stock's closing price for the current chart interval with the previous interval's close. A positive change counts as advancing. A zero or negative change goes into declining, meaning that this label includes stocks whose closing price did not move. Understanding that convention matters before interpreting a red count as the number of actual price falls.
The net-advancers figure subtracts the declining count from advances. The advancing/declining ratio divides advances by declines. In a hypothetical group with 60 rising stocks, 30 falling stocks and 10 unchanged stocks, the displayed counts would be 60 and 40. Net advances would be 20 and the ratio 1.5, rather than 2.
The volume measures answer a different question: what share of all trading volume belongs to each group? Counting companies and dividing their traded volume can produce different pictures, because a stock's contribution to a volume total need not equal its share of the company count.
[2]Read each moving average as a separate test
A simple moving average, or SMA, is the average closing price across a specified number of trading days. TradingView calculates breadth for 20, 50 and 200 days by checking each stock against its own average. It then expresses the qualifying count as a percentage of all stocks in the selected group.
The comparison is strictly greater than the average. A stock closing exactly on that level does not qualify as above it. If 70 of 100 stocks exceed their own 50-day averages, the breadth reading is 70%; it is not a claim that the index gained 70%.
These windows describe different horizons. A short-term reading and a long-term reading can differ because they compare current prices with different histories. Reading the period label is therefore part of interpreting the result, rather than treating every percentage as an interchangeable strength score.
[3]A new high depends on the chosen window
The high-and-low measures use one-week, one-month, three-month and one-year windows. TradingView compares the current session's highest and lowest prices with the corresponding extremes over the selected period. Matching the period's extreme is sufficient: the high test uses greater-than-or-equal, and the low test uses less-than-or-equal.
This differs from simply counting higher closes. A stock can advance without reaching the top of its recent range. Similarly, reaching a weekly high does not establish a yearly high, because the longer window can contain a higher price.
The net-highs percentage subtracts new lows from new highs, divides by the number of stocks and multiplies by 100. For a hypothetical 100-stock group with 12 new highs and seven new lows, the result is 5%. That measures the balance of counts, not the average return those stocks earned.
[4]Compare stocks with their benchmark
TradingView's current help documentation also explains outperformance: how a stock's return compares with an index. A benchmark is the reference index used for comparison: the index itself for an index group, or the most representative index for a country.
Most major indices weight companies by market capitalization, the market value of their outstanding shares. Larger companies therefore have more influence on the index. The documented outperformance fields count stocks whose price return exceeds their benchmark over one or three months. A rising stock can therefore still underperform a faster-rising index.
The equal-weight comparison instead averages all constituent price returns over one month and subtracts the benchmark return. If that average is 2% and the benchmark gains 5%, the difference is minus three percentage points. It describes a gap between performances, not a three-percent loss for the average stock.
[5]Distinguish the measures
Match the displayed field to its question.
| Case | What it means |
|---|---|
| Direction | Closing-price change Advancing and declining counts include unchanged stocks in the latter group. |
| Trend | Own price history An above-average percentage tests each stock against its own moving average. |
| Extremes | Selected price window Highs and lows compare session extremes with the chosen lookback period. |
| Relative return | Benchmark comparison Outperformance compares a stock with an index over the same period. |
The examples in the article are hypothetical, not current market readings. [2] [3] [4] [5]
- Counts and returns describe different things.
Official sources & further reading
Independently written from the primary sources below. Checked on 1 October 2026.
- Market breadth announcement ↗Official announcement
- Advancing and declining ↗Official supporting documentation
- Above moving averages ↗Official supporting documentation
- New highs and lows ↗Official supporting documentation
- Outperforming the index ↗Official supporting documentation
30-day trial + $15 first-plan coupon
New-user eligibility applies. No code needed; check renewal pricing and coupon terms.
Permanent partner link. Campaign dates and benefits are separate.
We may earn a commission, at no extra cost to you. Account and country conditions apply.