At a glance
- What changed
- Greater-than and less-than conditions for rectangles.
- Who it affects
- Users monitoring price zones on charts.
- When
- Announced August 21, 2026.
TradingView welcome offer and conditions ↓
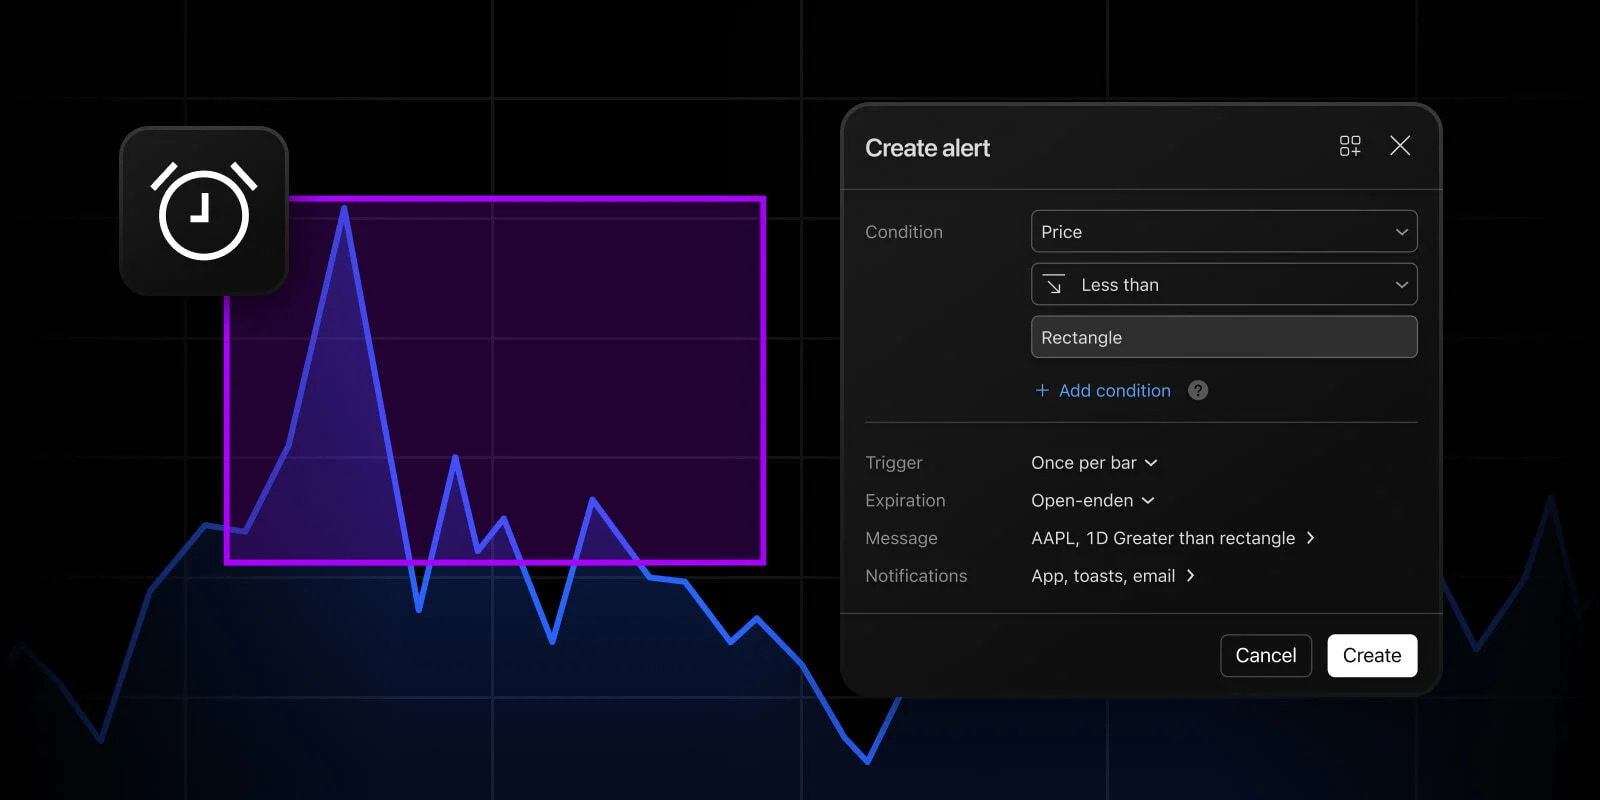
Two new ways to watch a drawn zone
TradingView rectangle alerts now offer Greater than for price above the upper edge and Less than for price below the lower edge. Open the drawing’s alert menu, choose the condition, then set notification frequency and delivery. Resizing the rectangle updates the boundary.
That gives a drawn zone a more specific purpose. Instead of referring vaguely to price being near a box, you can identify exactly which side you want to observe. The chosen frequency still determines how that observation becomes a notification.
[1]Frequency determines when a matching condition matters
TradingView’s alert-frequency guide distinguishes a one-time notification from notifications evaluated per bar or at bar close. “Once per bar” allows a trigger when the condition is met within that bar, no more than once for the bar. “Once per bar close” waits for the closing evaluation. The condition and its frequency are separate parts of the setup.
This distinction matters when a price briefly moves beyond a level and then returns. The fact that the boundary was exceeded at some point does not establish that the closing observation also exceeded it. Choose the available frequency that matches the question you actually want the alert to answer, and review it in the alert dialog.
[2]An example using a zone from 90 to 100
Imagine a rectangle whose lower edge is 90 and upper edge is 100. At a hypothetical price of 105, the price is above the upper edge. At 85, it is below the lower edge. At 95, it is between them. These invented values make it easy to identify which side each condition concerns without relying on trading jargon.
Now consider a sequence during one bar: 98, then 103, then 99 at the close. The price spent part of the bar above 100, yet the closing value is below 100. A question about whether the boundary was exceeded during the bar differs from a question about the closing value. Neither observation contradicts the other; they describe different moments.
This is also why an alert name should reflect its purpose. “Above the upper zone edge” is more descriptive than “breakout confirmed” unless you have separately defined what confirmation means. A notification reports a configured condition. Any stronger interpretation needs an explanation of the additional evidence being used.
Changing the rectangle changes the reference
Using the same example, suppose you move the upper edge from 100 to 108. A price of 105 was above the previous edge but is now below the revised edge. The market price did not change in this comparison; your reference changed. Recording that adjustment makes subsequent notifications easier to interpret.
For an organized workflow, note the original boundaries and why you selected them. If you revise the zone after new information, write down the new boundaries and the reason. This prevents a chart from becoming a series of silent edits that make an earlier decision appear different when viewed later.
You can also test your understanding before activating a useful notification. Pick one imagined price inside the zone, one above it and one below it. State in plain language which condition each would satisfy. If that exercise is confusing, simplify the drawing or the alert name before adding more conditions to your research process.
Using alerts as prompts to review
A practical alert message can identify the instrument, the zone being watched and the reason for checking it. The next step after receiving it can then be a deliberate review of the chart and the relevant information. That is a clearer process than assuming the notification has already made a trading decision for you.
The selector below helps distinguish the rectangle’s two boundaries. It is an explanation of the condition, not a live alert service. For a complete setup, confirm the drawing, frequency and notification destination together. The feature is useful when those details match your intended observation, because you can understand precisely why a future notification arrived.
Dates to know
As announced by the provider. A listed date does not confirm current availability or eligibility.
- Rectangle boundary conditions releasedDate passed[1]
Follow the example zone
Choose an illustrative case to follow the explanation.
| Case | What it means |
|---|---|
| Price 105; edge 100 | Five above the edge The invented price 105 is above the reference 100. |
| Price 105; edge 108 | Three below the revised edge The price stayed 105; the reference moved. A changed drawing can change the comparison without a price change. |
Original learning exercise; no live market data or account action.
- Greater than follows the upper edge; Less than follows the lower edge.
Official sources & further reading
Independently written from the primary sources below. Checked on 26 September 2026.
- Rectangle alerts now support Greater than and Less than conditions ↗Announcement · 21 August 2026
- TradingView’s alert-frequency guide ↗Official product documentation
30-day trial + $15 first-plan coupon
New-user eligibility applies. No code needed; check renewal pricing and coupon terms.
Permanent partner link. Campaign dates and benefits are separate.
We may earn a commission, at no extra cost to you. Account and country conditions apply.